

Monitoring & traffic
The lower section of your server’s detail page shows live performance metrics and traffic statistics, so you can see what your server is doing at a glance.
Live charts
Section titled “Live charts”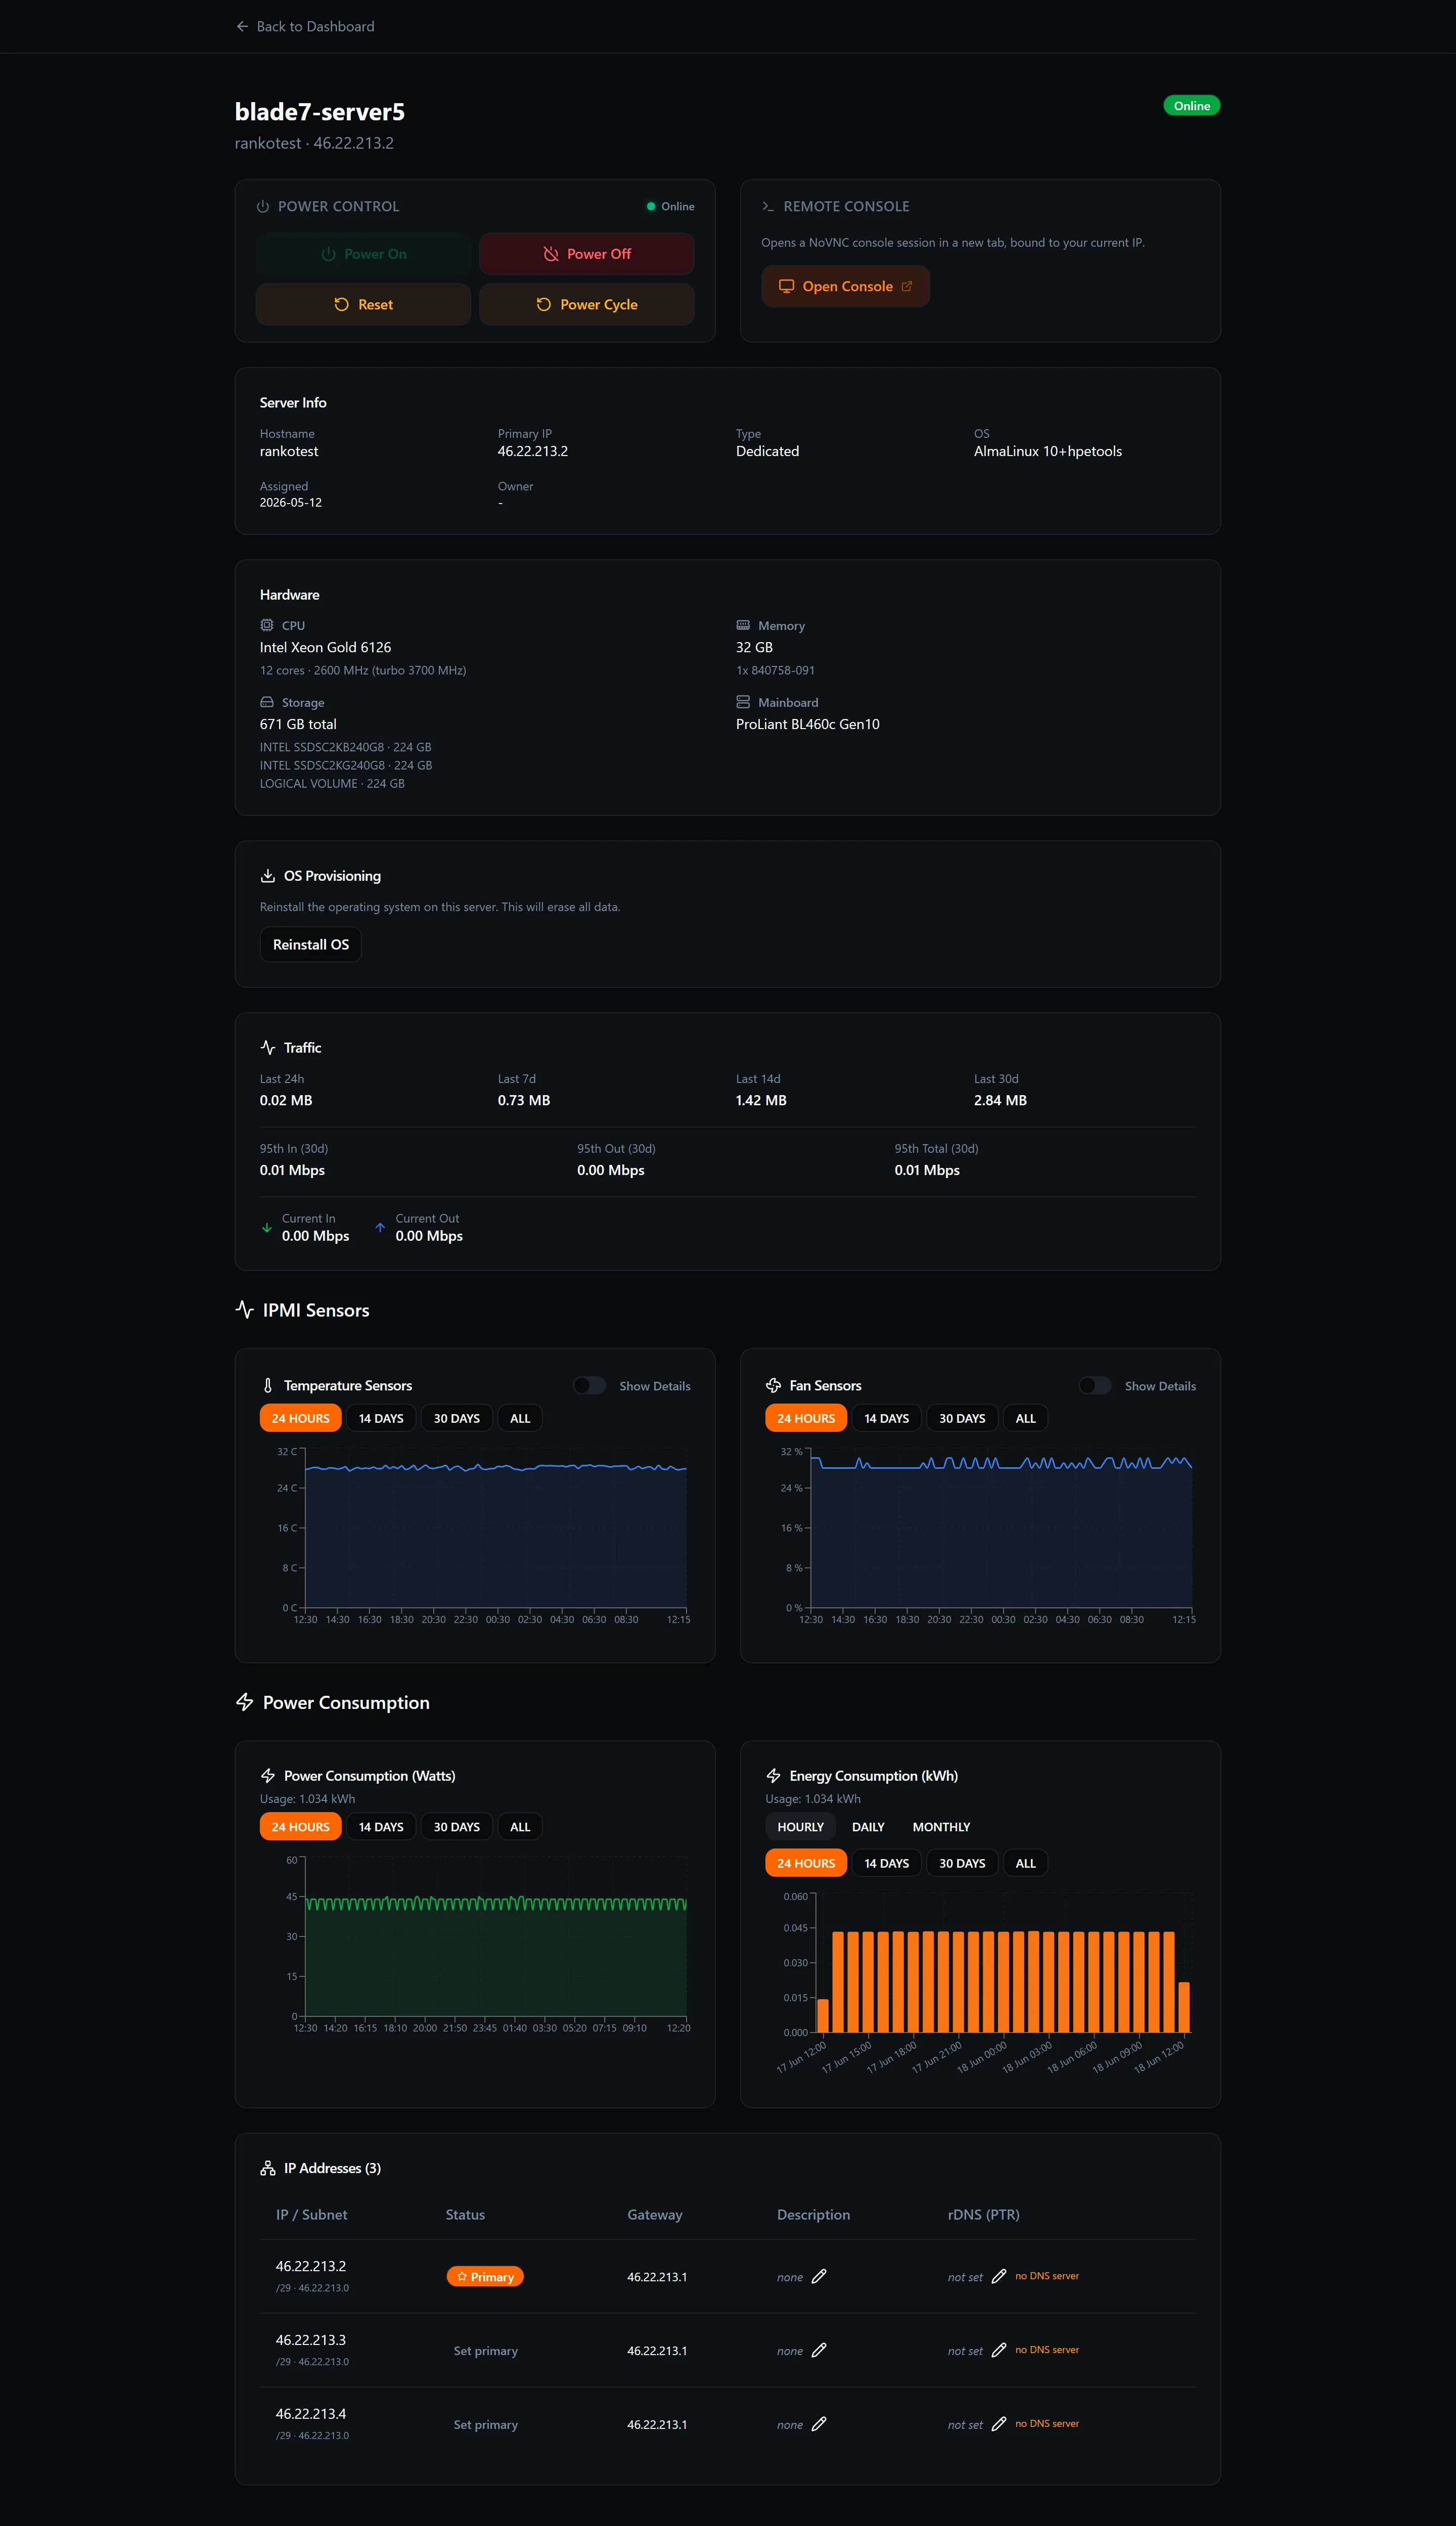
Four charts update in real time:
- CPU — current processor utilisation as a percentage.
- Memory — RAM in use versus total available.
- Network — inbound and outbound throughput.
- Disk — read and write activity on the primary disk.
Time range
Section titled “Time range”Use the time-range selector above the charts to zoom in or out. Available options typically include the last hour, last 24 hours, last 7 days, and last 30 days. Zooming out is useful for spotting trends; zooming in helps you investigate a specific spike.
Traffic totals
Section titled “Traffic totals”Below the charts, the Traffic section shows:
- Used this month — total data transferred (inbound + outbound) since the start of the billing period.
- Monthly allowance — the bandwidth included in your plan.
If your usage approaches the monthly allowance, consider reducing transfer-heavy workloads or contacting support to discuss an upgrade.